

If you’ve looked into your business page’s Facebook Insights tab recently, you know the amount of data provided about your page can almost seem overwhelming if you don’t know the meaning behind the numbers you see.
It’s important to understand what information Facebook is collecting to be able to use it to refresh your current content plan.
Here’s a quick overview of 4 analytics features inside of Facebook Insights, and how the results you see should influence the content you create and share.
Likes
Likes are (obviously) how many people like your page. But that’s not all that the Likes tab shows. Beyond seeing the number of Likes your page has, you’ll see the growth, averages, and sources of the Likes.
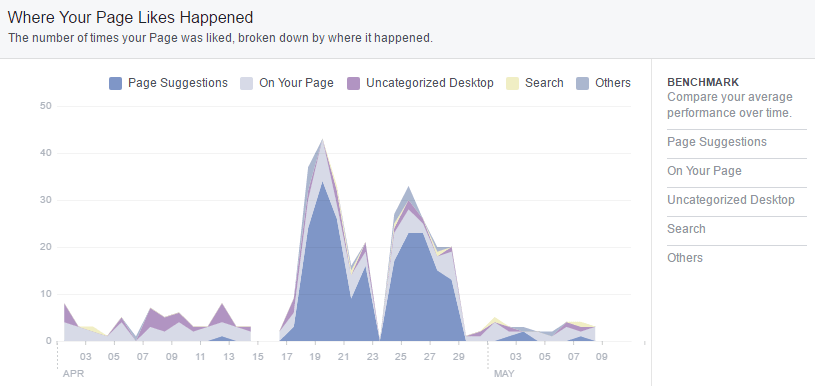
Use the “Where Your Page Likes Happened” graph to see the number of times your page was liked based on where that action happened. You’ll see if the Facebook user converted on your page, via page suggestions, or through any Page Like ads you run.
Reach
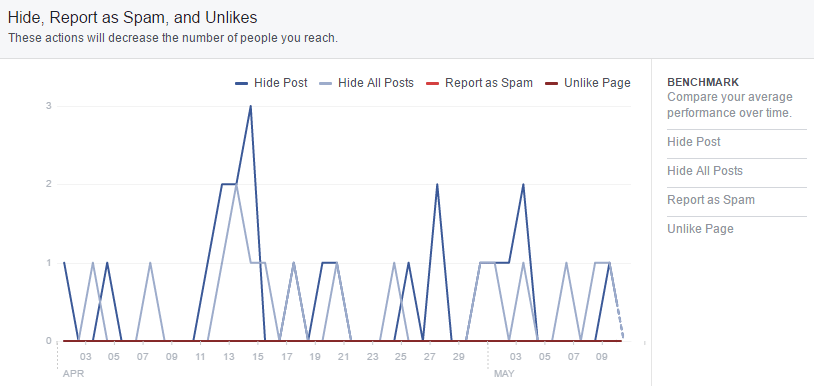
Reach is the number of people your posts are served too. In this tab of your Page Insights, you can not only see overall total reach, but also post reach, reactions, comments, and shares. This tab also includes hides, unlikes, and times a post was reported as spam.
The latter forms of negative feedback are used to tell Facebook which posts users want to see less of. While learning that some of your content isn’t hitting the mark is not pleasant, this graph is great for understanding the kinds of content you should avoid posting.
Use the graphs in this tab to look for trends in your posts. If there is a spike in reach on a certain day, find out what kind of content posted that day and try to repeat that success!
Posts
The posts tab shows information about how well your posts are performing and a little bit of data about your audience.
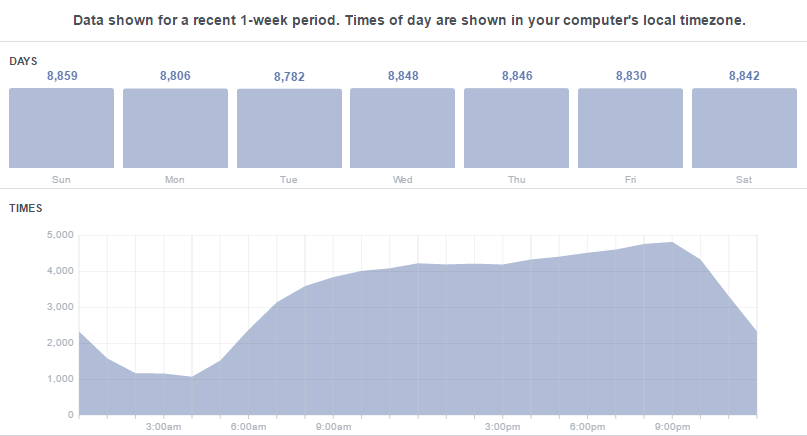
First, you’ll see when your fans are online. This graph shows the trend of what time your audience is online for each day of the week. There is a best time to post on Facebook, and it is a brand-specific time, meaning it’s different for everyone. Use this graph to see how active your Facebook audience is and pick the best time for your posts to go out based on when will be the best for engagement.
Note: these times can shift weekly, so it’s best to check on them a few times a month. Also, Facebook’s Algorithm isn’t structured to serve posts immediately to your entire audience, so it’s best to publish a post a little before the time when your largest audience will be online.
In this insights tab, you can also see what types of posts perform best in terms of reach and engagement. Whether it’s photo posts, videos, or links that perform best, you can use this information to create the right posting strategy for your brand.
Another cool feature on this tab is Top Posts from Pages You Watch. Before you can use this, however, you need to set up your Pages to Watch section in the Overview tab. The pages you choose to monitor could be direct competitors you want to keep an eye on, similarly-sized businesses in your market for benchmarking, or pages you feel are targeting the same type of customer you would like to have. Once Pages to Watch is set up, you can look at the posts that are performing the best (and worst) for those pages. Use this information to learn even more about what types of content might work for your brand and resonate with your target customer.
People
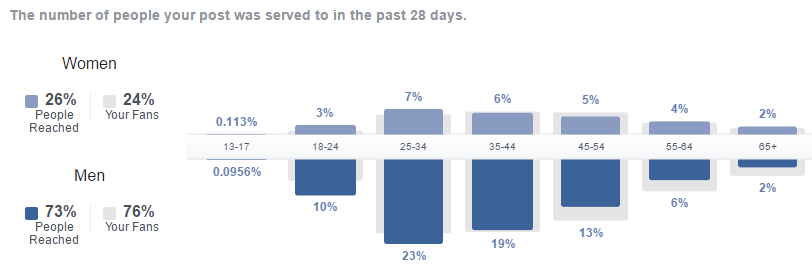
The People tab of your Page Insights analyzes your current fans, the people your posts are reaching, and those who are engaging with your posts. It breaks your audience down by gender and age, as well as shows the top countries and cities they’re in and the language they speak.
When you look at the People Reached and People Engaged graphs, you’ll notice there’s a second percentage that shows that the people who are reached or who engage with your posts are not necessarily your fans.
Compare this information with your target audience, or the audience you want to reach through your social media marketing. If your ideal customer is women ages 25-34, and your posts are reaching more men ages 45-54, you might want to make some changes to the type of content you are posting.
Improve your strategy
The analytics Facebook offers business pages are a fantastic source of information that you should take advantage of when creating your social media strategy. There are even more insights to look at than what I’ve talked about here, so be sure to poke around your Insights tab to learn more about your page, your posts, and your audience.